After years of work, the doldecomp/melee community has completed a matching decompilation of Super Smash Bros. Melee. The reconstructed source now compiles to the original machine code. That is an enormous milestone, and it gives people a foundation for reading, building, and studying the game.
A matching decompilation is not the same as a complete understanding of the game. There are still functions with placeholder names, structures whose purpose is unclear, and systems whose behavior needs to be observed while Melee is running. Finishing the match opens the next stage of reverse engineering: explaining what all that recovered code means.
The decompilation helped make Super Slop Bots possible. We built on the source and knowledge its contributors recovered. The debugger stack in this post is our contribution back: a way for more people to connect that source to the running game, test ideas, and replace guesses with evidence.
From matching code to understanding it
Much of reverse engineering happens by reading. You compare an unknown function with code that is already understood, follow the data moving through it, infer its role, and improve its names. Melee decompilation contributor Mark McCaskey calls this “Sudoku-style” reverse engineering: every known relationship gives you another constraint.
Sometimes the surrounding code is also unknown, or a value only makes sense in motion. Then you need to run the game and observe it. Mainline Dolphin includes useful debugging tools and can load a symbol map, but it does not provide the source-level workflow people expect from a modern editor.
Our dolphin-dap fork of Dolphin adds support for debugging an ELF with its DWARF information and exposes Dolphin’s PowerPC debugger through the Debug Adapter Protocol. You can stop Melee on a source line and inspect local variables, global state, structures, PowerPC registers, and the call stack that led there. Those views use the types and names recovered by the Melee decompilation community.
How the stack fits together
Source-level debugging requires three pieces:
- A debug ELF. Building
doldecomp/meleewith symbols produces an executable that contains the game and debugging metadata. That metadata connects machine-code addresses to source lines, variables, and structure definitions. - A DAP server. DAP, the Debug Adapter Protocol, is a common language between debuggers and development tools. The server built into our
dolphin-dapfork can inspect Melee’s emulated execution and answer DAP requests. - A DAP client. The client is the interface used to pause, resume, step, set breakpoints, and inspect state. We maintain separate client repositories for VS Code, Neovim, and MCP clients. None of these clients is bundled into the
dolphin-dapfork.
The matching decompilation is essential here. Earlier builds could provide symbols or partial source information, but the current project can produce a debug ELF in which the executed code and its debugging information agree across the game. Congratulations to the Melee decompilation project on reaching that point, and thank you to every doldecomp/melee contributor. This work depends on theirs.
What Dolphin DAP can inspect
The DAP server lives beside Dolphin’s PowerPC debugger, where it can inspect emulated execution, memory, symbols, and source information. It supports the tools people expect from a source debugger:
- pause, continue, restart, and step through code
- breakpoints on source lines, instructions, and memory
- call stacks and PowerPC registers
- local and global variables, structures, pointers, and arrays
- expression evaluation, memory access, source retrieval, and disassembly
It also provides game-oriented tools such as live memory watches, frozen values, memory scans, pointer-chain resolution, free-memory searches, PowerPC code injection, and detours. These are sharp tools. Reading memory observes the game; freezing, writing, injecting, or detouring changes it and can invalidate an experiment.
Build a debuggable Melee ELF
First follow the decompilation project’s getting-started guide to prepare the repository and the required files from your own copy of Melee.
Configure a debug build. Since doldecomp/melee pull request #3466 was merged, --debug enables symbols and disables optimization. Disabling optimization is important because compiler optimization makes source-level stepping unreliable and prevents local variables from updating correctly in the DAP client.
python3 configure.py --debug
ninja
This produces build/GALE01/main.elf. The ISO still supplies the game’s disc files, but Dolphin executes the ELF so that the running code matches its debugging information. DAP relies on the ELF’s symbols and DWARF information.
Start with VS Code
If you are unfamiliar with debuggers, start with VS Code and our dolphin-dap-vscode extension. Its Run and Debug view keeps source code, variables, the call stack, and breakpoints visible alongside controls for pausing and stepping.
Build the fork’s NoGUI target by following the dolphin-dap server guide, then follow the VS Code extension installation instructions.
The following Linux configuration reproduces our end-to-end setup. It separates building Melee, launching Dolphin, and stopping Dolphin into distinct tasks. Build and Debug runs the build and launch tasks in sequence, while Debug launches the existing ELF. The launch task records Dolphin’s process ID and waits for its DAP socket; the stop task uses that process ID to clean up Dolphin when debugging ends.
Add .vscode/tasks.json to the Melee checkout. Replace /path/to/dolphin-dap and /path/to/melee.iso with the paths to your dolphin-dap build and legally obtained Melee disc image:
{
  "version": "2.0.0",
  "tasks": [
    {
      "label": "Build Dolphin Debug ELF",
      "type": "process",
      "command": "/bin/bash",
      "args": [
        "-c",
        "set -e\npython configure.py --debug\nninja"
      ],
      "options": {
        "cwd": "${workspaceFolder}"
      }
    },
    {
      "label": "Launch Dolphin DAP",
      "type": "process",
      "command": "/bin/bash",
      "args": [
        "-c",
        "set -e\nsocket=$1\npidfile=$2\nif [ -f \"$pidfile\" ]; then\n  IFS= read -r old_pid <\"$pidfile\"\n  kill \"$old_pid\" 2>/dev/null || true\nfi\nrm -f \"$socket\" \"$pidfile\"\nnohup \"$3\" -C \"Dolphin.General.DAPSocket=$socket\" -C \"Dolphin.Debug.SourcePaths=$6\" -C \"Dolphin.Core.DefaultISO=$4\" -C Dolphin.Core.BootExecutableWithDefaultDisc=true --exec \"$5\" --platform x11 >build/dolphin-dap.log 2>&1 &\ndolphin_pid=$!\nprintf '%s\\n' \"$dolphin_pid\" >\"$pidfile\"\ncleanup() {\n  kill \"$dolphin_pid\" 2>/dev/null || true\n  rm -f \"$socket\" \"$pidfile\"\n}\ntrap cleanup ERR INT TERM\nuntil [ -S \"$socket\" ]; do\n  kill -0 \"$dolphin_pid\"\n  sleep 0.1\ndone\nprintf 'Dolphin DAP ready\\n'",
        "launch-dolphin",
        "${workspaceFolder}/.dolphin-dap.sock",
        "${workspaceFolder}/.dolphin-dap.pid",
        "/path/to/dolphin-dap/build/Binaries/dolphin-emu-nogui",
        "/path/to/melee.iso",
        "${workspaceFolder}/build/GALE01/main.elf",
        "${workspaceFolder}/src;${workspaceFolder}/extern/dolphin/src"
      ],
      "options": {
        "cwd": "${workspaceFolder}"
      },
      "presentation": {
        "reveal": "always",
        "panel": "dedicated"
      }
    },
    {
      "label": "Build and Launch Dolphin DAP",
      "dependsOrder": "sequence",
      "dependsOn": [
        "Build Dolphin Debug ELF",
        "Launch Dolphin DAP"
      ],
      "problemMatcher": []
    },
    {
      "label": "Stop Dolphin DAP",
      "type": "process",
      "command": "/bin/bash",
      "args": [
        "-c",
        "pidfile=$1\nsocket=$2\nif [ -f \"$pidfile\" ]; then\n  IFS= read -r dolphin_pid <\"$pidfile\"\n  kill \"$dolphin_pid\" 2>/dev/null || true\nfi\nrm -f \"$pidfile\" \"$socket\"",
        "stop-dolphin",
        "${workspaceFolder}/.dolphin-dap.pid",
        "${workspaceFolder}/.dolphin-dap.sock"
      ],
      "problemMatcher": []
    }
  ]
}
Then add .vscode/launch.json:
{
  "version": "0.2.0",
  "configurations": [
    {
      "name": "Build and Debug",
      "type": "dolphin",
      "request": "attach",
      "preLaunchTask": "Build and Launch Dolphin DAP",
      "postDebugTask": "Stop Dolphin DAP",
      "socket": "${workspaceFolder}/.dolphin-dap.sock",
      "stopOnEntry": true
    },
    {
      "name": "Debug",
      "type": "dolphin",
      "request": "attach",
      "preLaunchTask": "Launch Dolphin DAP",
      "postDebugTask": "Stop Dolphin DAP",
      "socket": "${workspaceFolder}/.dolphin-dap.sock",
      "stopOnEntry": true
    }
  ]
}
Open Run and Debug and choose Build and Debug. VS Code configures the non-optimized ELF, builds it with Ninja, starts Dolphin, waits for the DAP socket, and then attaches the extension. After the first build, choose Debug when you want to relaunch the existing ELF without rebuilding it. Ending either debug session runs Stop Dolphin DAP.
The extension itself remains attach-only. The preLaunchTask is what turns that attachment into one action: it prepares Dolphin before the extension connects. The example uses Bash, a Unix-domain socket, and Dolphin’s X11 platform, so other operating systems or display backends require corresponding changes.
A working Neovim setup
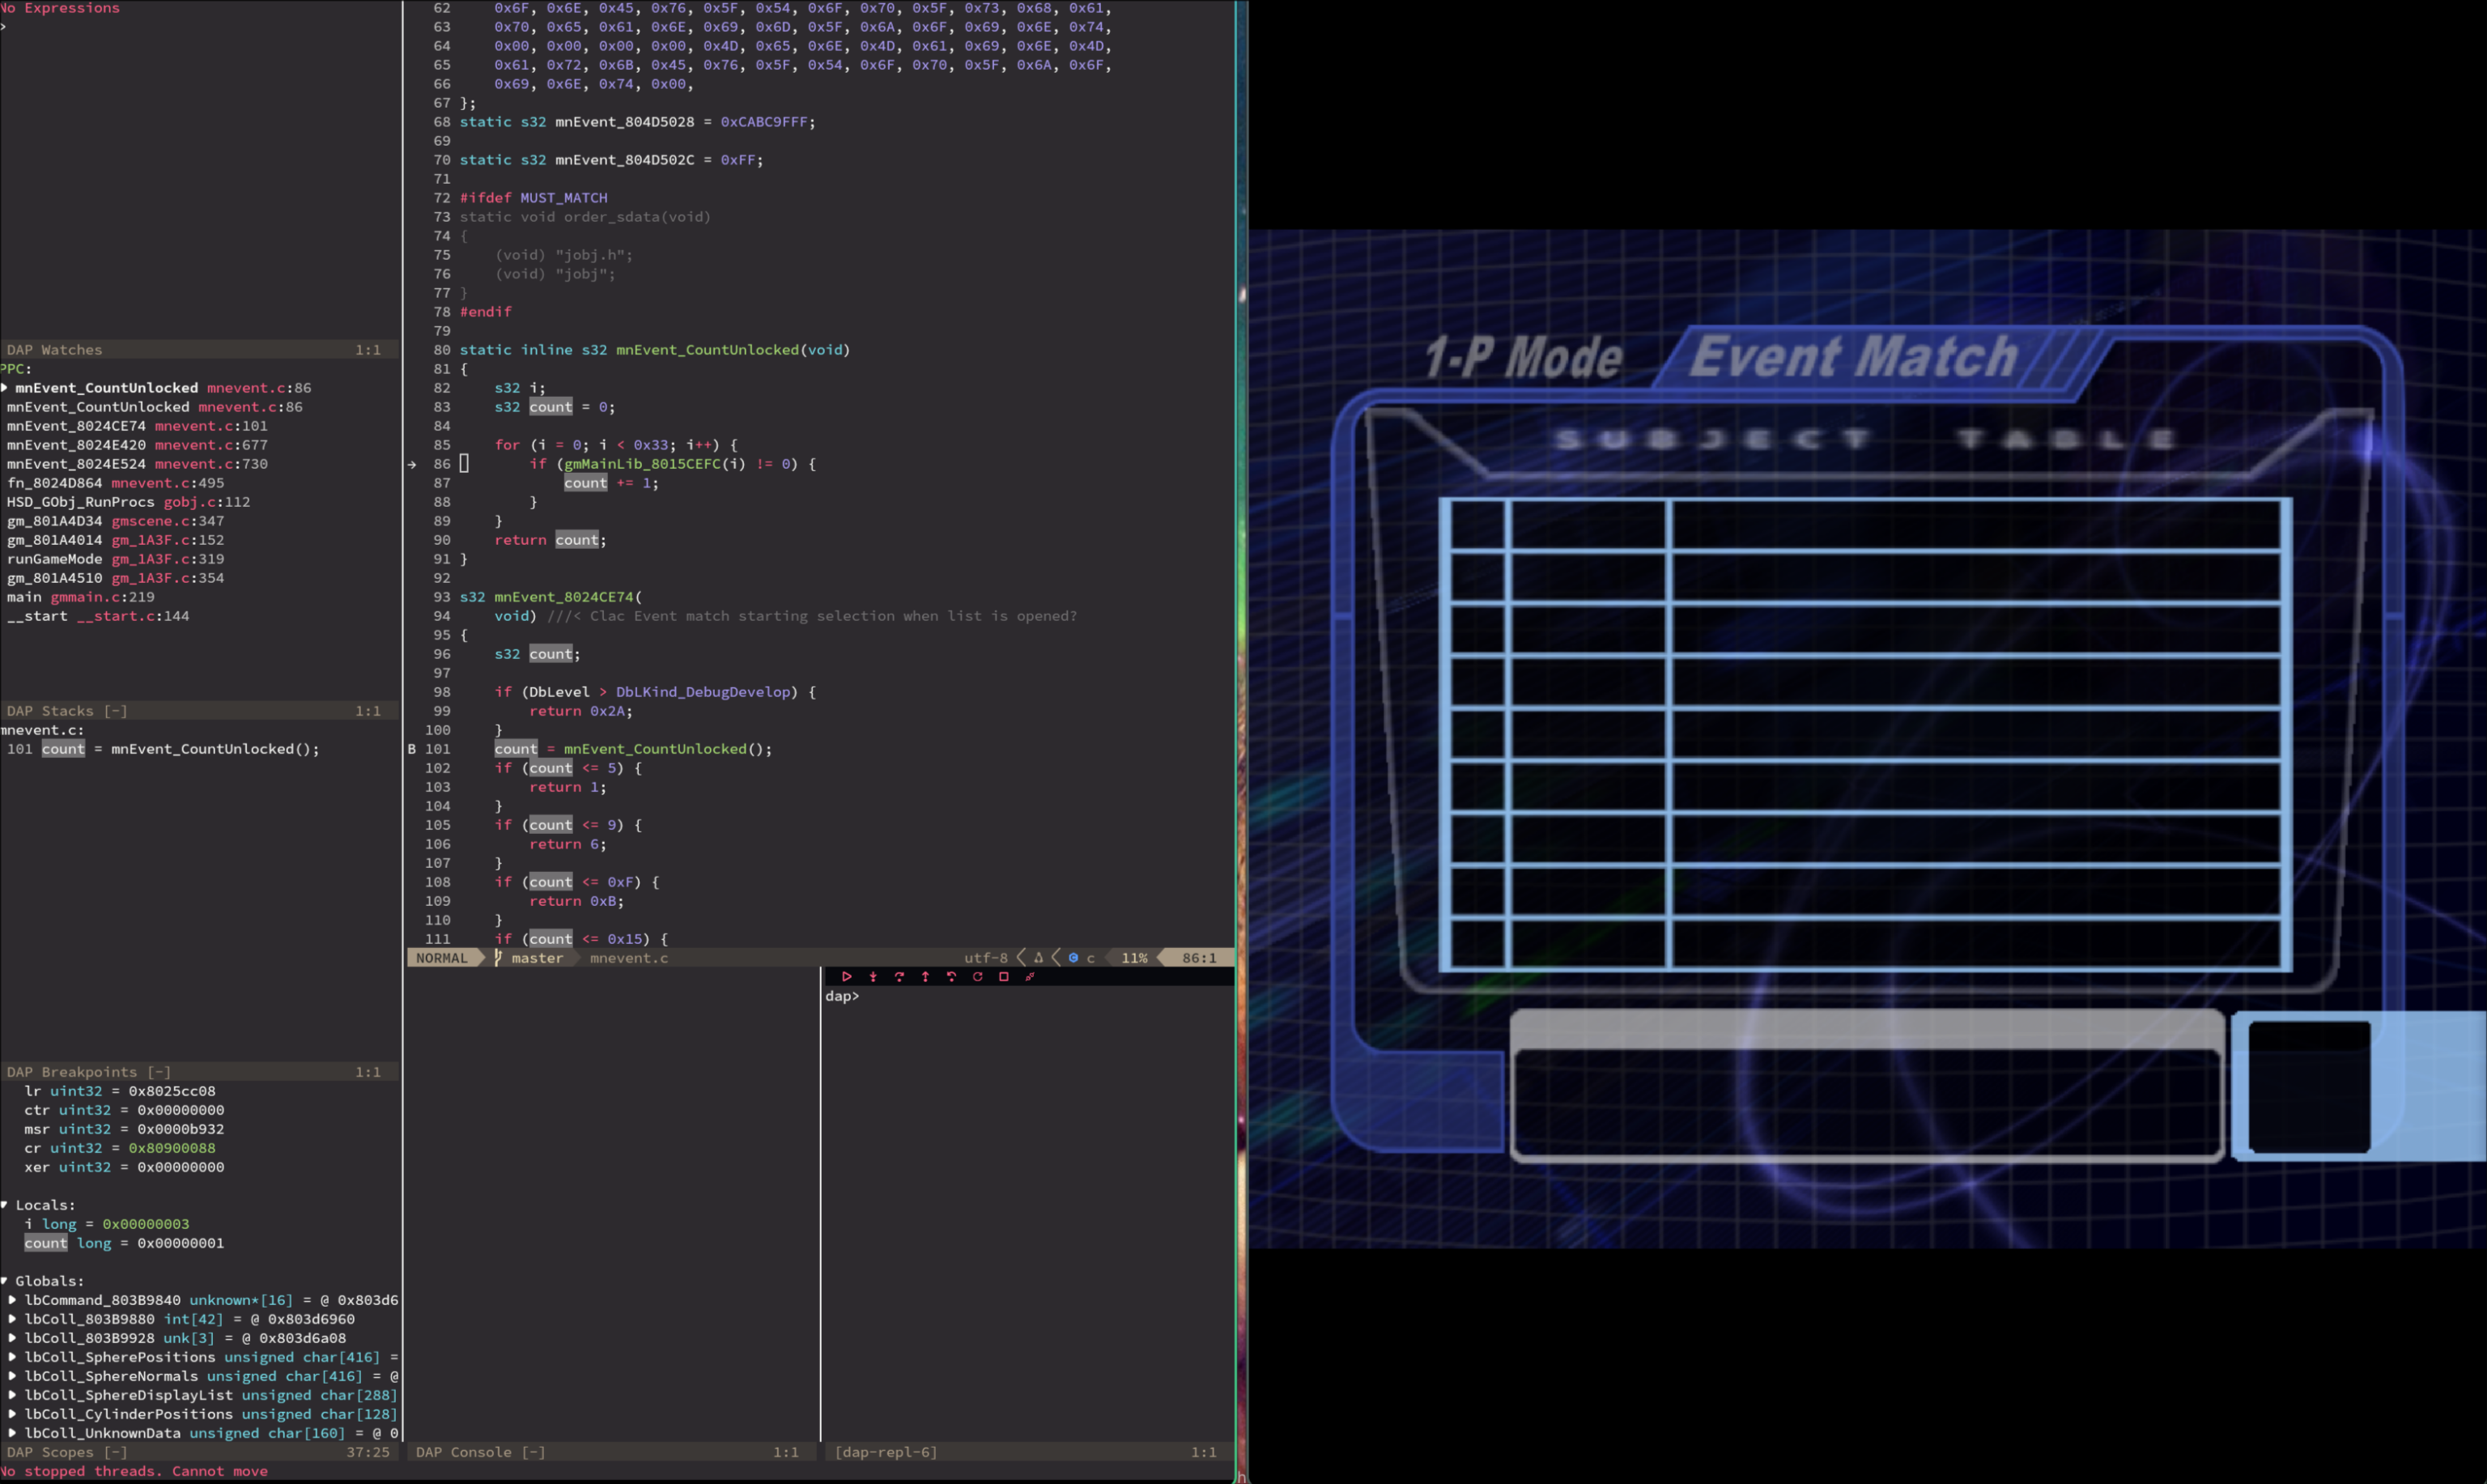
If you already use Neovim, dolphin-dap-nvim connects nvim-dap to Dolphin and can launch the project from .dolphin-dap.lua. It follows the normal nvim-dap commands and keeps interface plugins optional.
We tested this stack against a real debug build from doldecomp/melee. Here, Melee is paused at a source breakpoint in Neovim while the debugger shows the call stack, PowerPC registers, local variables, and global state beside the running game:
Here is the .dolphin-dap.lua shape we used. Replace the three machine-specific paths with your own:
return {
  dolphin = "/path/to/dolphin-dap/build/Binaries/dolphin-emu-nogui",
  program = "/path/to/melee/build/GALE01/main.elf",
  disc = "/path/to/melee.iso",
  cwd = "/path/to/melee",
  source_paths = {
    "/path/to/melee/src",
    "/path/to/melee/extern/dolphin/src",
  },
  enable_cheats = false,
  port = 5678,
}
The order of source_paths matters because some compiler records contain only a filename. We validated source lookup, a thirteen-frame call stack, registers, expressions, memory regions, scanning, pointer chains, disassembly, live watches, source breakpoints, instruction stepping, resume, and disconnect against this setup.
AI can assist, not decide
dolphin-dap-mcp is a separate MCP server that lets a compatible AI client use the debugger. Its README includes installation instructions and an example MCP configuration. Once connected, an agent can start or attach to Dolphin, set a breakpoint, inspect a stack, read variables or memory, disassemble code, and gather evidence about what the game is doing.
This lets an agent test a guess instead of only reasoning from source code. It can also repeat a long sequence of debugger operations and record what happened. That does not make its conclusions correct.
Nothing produced by an AI agent should be taken at face value. An AI can misread a value, confuse correlation with cause, invent a confident explanation, or modify the running game in a way that invalidates its own result. AI-generated findings need at least as much scrutiny as human-generated findings, and often more. Check the source, reproduce the steps, inspect the raw debugger output, and ask whether the evidence supports the claim.
Help identify the unknowns
You do not need to be a professional programmer to help. Choose one small part of Melee that interests you and ask a question you can observe: When does this function run? Which value changes when a character lands? Does the same path execute for every fighter?
Set a breakpoint, perform one controlled action, and record what happened. Change one condition and repeat it. Useful evidence can be as simple as confirming when a function runs, connecting a value to an on-screen action, or writing reproduction steps that somebody else can verify. A careful observation is more valuable than a clever guess.
Before renaming code or changing a structure, search the source to see what is already known. Bring questions and uncertain findings to the #smash-bros-melee channel in the GameCube/Wii Decompilation Discord, where contributors coordinate this kind of investigation. When the evidence is ready for a code contribution, follow the project’s contributing guidelines. Include the source location, build revision, breakpoint or address, exact steps, observations, and anything that remains uncertain so another contributor can reproduce your work.